Hämmästyttävää, mutta automarkkinamuutos Suomessa näyttää menevän lähes täysin Vinkhuyzen, M. (2019) piirtämän Osbourne Effect graafin mukaan. Linkki artikkeliin.
- Vinkhuizen arviossa fossiiliset -40% ja BEV +11%
- Mikan Suomi-tilastossa fossiiliset -45% ja BEV +12%
 |
| Vinkhuizen Osborne effect kuvaaja ja Suomen automarkkinamuutoksen tilanne, mikä seuraa lähes täysin neljä vuotta sitten tehtyä ennustetta. |
Suomen automarkkinan arvot laskettu @mkeskihe tilastotaulukon mukaan visuaalisesti määrittäen, mistä fossiilissa mukana myös PHEV. Jos sama tahti siis jatkuu, niin muutama haastava vuosi edessä, mutta..
Globaalisti katsoen tilanne on toinen ja Vinkhuyzen mainitsee, että: "The blue line is the carmakers’ reaction to the demand. It is way too optimistic — carmakers can’t scale this fast."
Sekä: "Probably at this moment your reaction is: “Ahh well, the carmakers have to do a bit more. Is that your nightmare?
...No, that is not the nightmare. The yellow line is.
...This yellow line is a big economic worldwide recession."
Kuulostaako tutulta?: "In the graph for drivetrain prices, the battery prices are slowly going down in the next decade. By far NOT fast enough to get the car prices on an affordable level for all car buyers."
Suomen markkinan osalta ei voi toki tehdä suurempaa analyysia koko maailman automarkkinan kehittymisestä, mutta suosittelen lukemaan tämän @mkeskihe alunperin suositteleman artikkelin (2019). Osa siitä saattaa jopa toteutua.
https://cleantechnica.com/2019/02/25/the-osborne-effect-on-the-auto-industry/
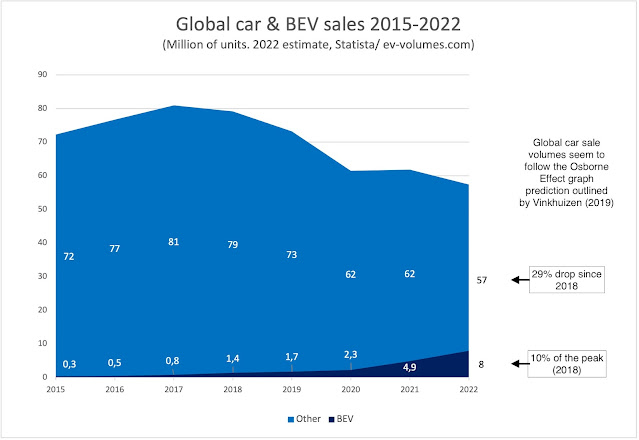
Oli toki pakko tarkistaa, että miltä 🌎🌍🌏 tilanne näyttää. Fossiiliset -29% ja BEV +10%. Täysin Osborne Efekti-graafin osoittaman ennusteen rajoissa, mutta fossiilisten myynti säilynyt hieman ennustetta paremmin.
Tässä kuvaajassa näkyy ICE globaalin myynnin jyrkkä lasku: 81M >>> 57M.
 |
| Automarkkinan muutos maailmalla. 2015-2022. |
Visa Siekkinen
Comments
Post a Comment